Accounting reports — where the money went
Six reports under Reports → Accounting. Between them they answer four questions: what came in, how it was paid, who still owes the practice, and what the practice still owes.
Accounting Report — the month on one page
The one to open first. Choose a Store, a Month and a Year — they open on your own store and the current month — then press Submit.
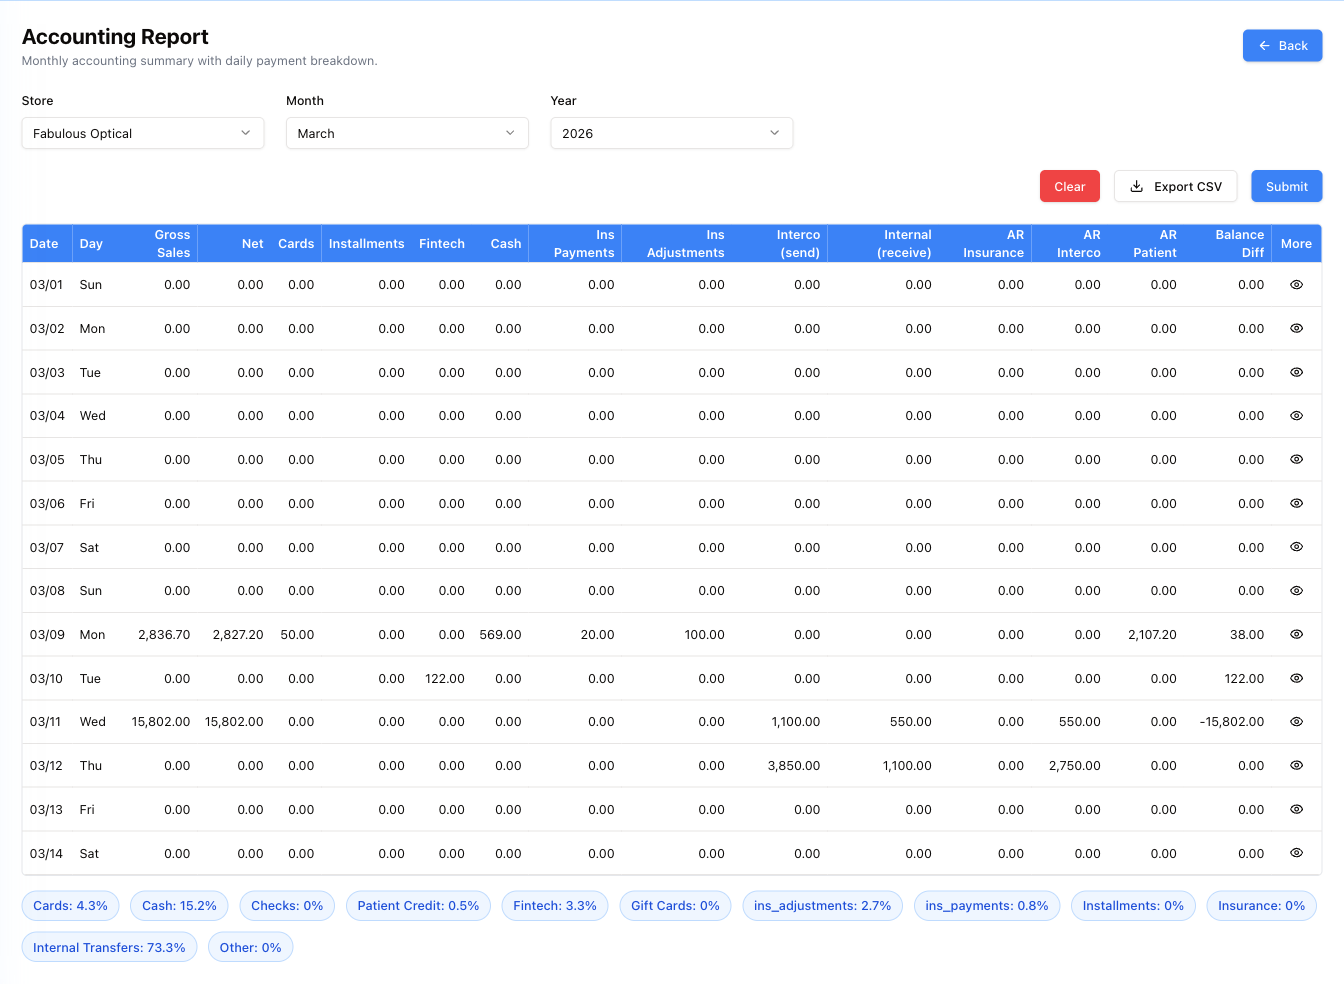
One row per day of the month — Date and Day first, then the money, and a bold Totals row closing the month. The money columns read from the top down:
| Column | What it is |
|---|---|
| Gross Sales / Net | Sold that day, before and after discounts |
| Cards, Installments, Fintech, Cash | Taken that day, split by how it was paid |
| Ins Payments | Received from insurers |
| Ins Adjustments | Written off against insurers — money that will never arrive |
| Interco (send) / Internal (receive) | Moved between the practice's own locations |
| AR Insurance, AR Interco, AR Patient | What went onto the books unpaid that day |
| Balance Diff | What the day's numbers do not reconcile to |
Balance Diff is the line to watch. On a clean day it is 0.00. Anything else means the day's sales and the day's payments do not agree, and the day is worth opening.
The blue chips under the table give the month at a glance as percentages — Cards 4.3%, Cash 15.2%, Internal Transfers 73.3% — so you can see the shape of the month without reading a single number.
Opening a day
The eye at the end of a row (the More column) opens that day in full. Four cards sit on top — Gross Sales, Net, Tax and Grand Total for that day — and Back to Summary returns to the month.
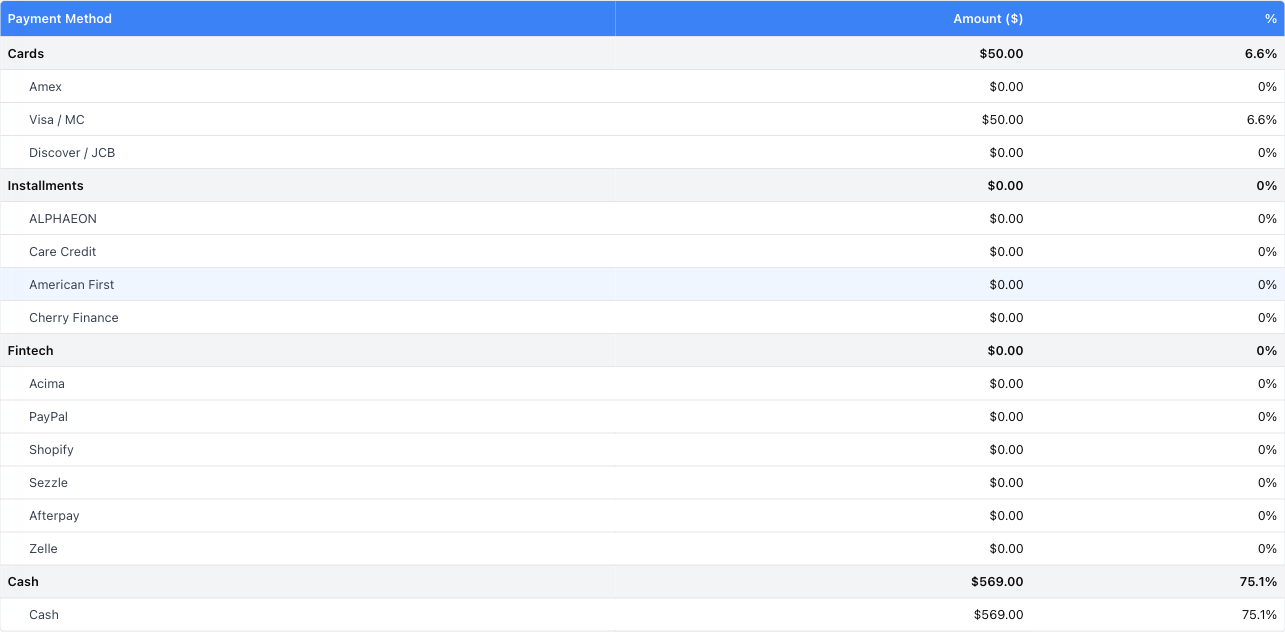
Every payment method the practice accepts, with the amount and its share of the day. Methods are grouped the way Payment Methods are categorised — Cards with Amex, Visa/MC and Discover under it, Fintech with PayPal, Zelle and the rest — so the group line is the total and the lines beneath it show what made it up.
Zero rows are shown too. That is deliberate: it is how you see that nothing at all came in on Care Credit this month.
Export CSV works once the report has run. From the month view it takes the whole month into a spreadsheet; while a day is open it takes just that day.
Payment Summary — one day, one line per method
Choose a Date and a Store — it opens on today and your own store; All locations is also in the list.
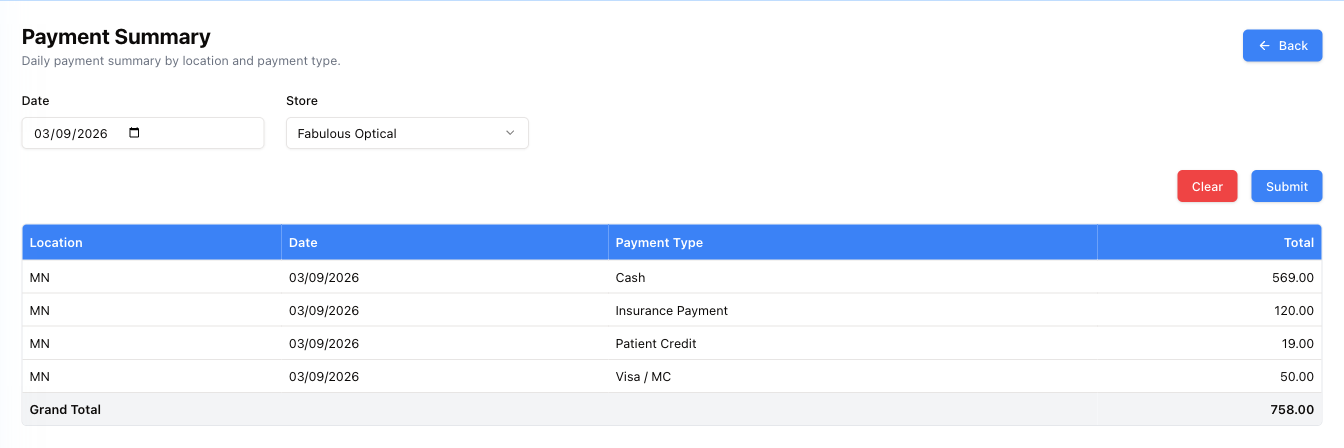
Four columns: Location, Date, Payment Type, Total, and a Grand Total underneath. That is the whole report.
Use it to close the day: it is the list you check the till and the terminal against.
Payment Details — every payment, line by line
Start date and End date (they open on the first of this month to today), plus a Store. The Store list starts on Default (from token), which means the store you are working in; All locations and each store are below it.
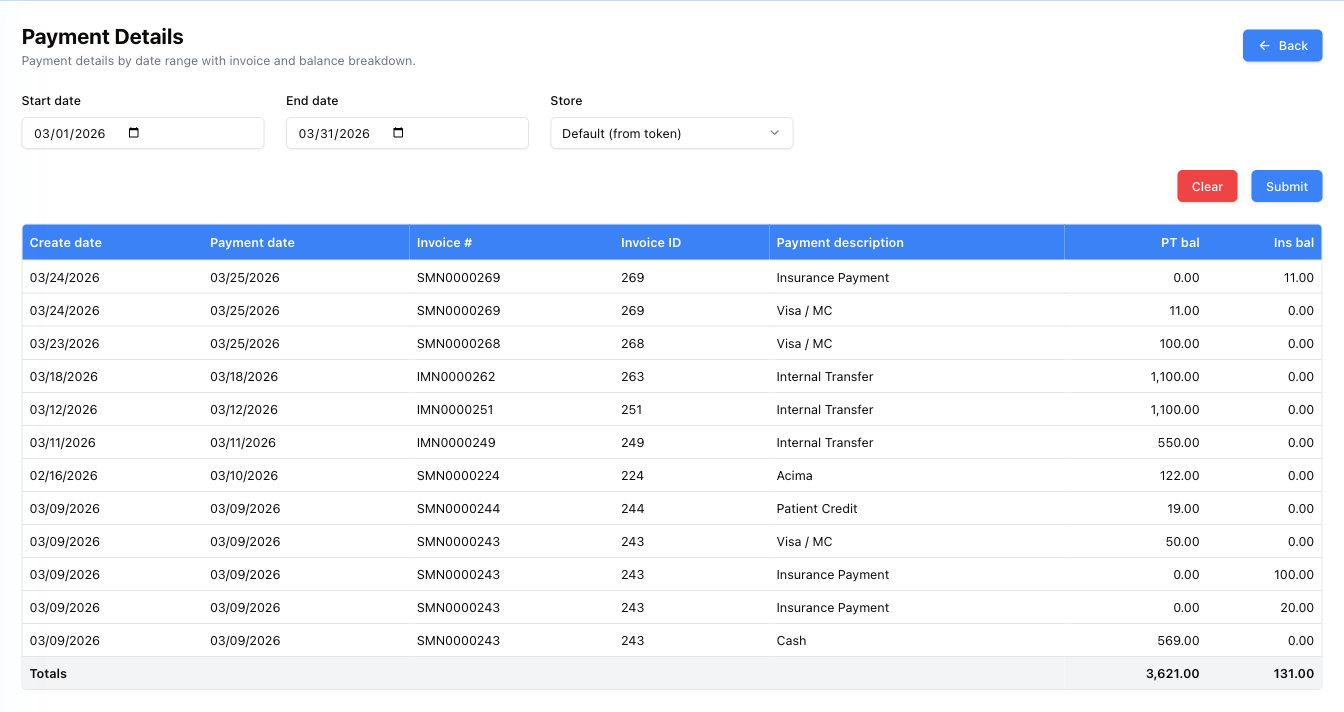
| Column | What it is |
|---|---|
| Create date | When the invoice was raised |
| Payment date | When the money actually arrived |
| Invoice # / Invoice ID | The invoice it belongs to |
| Payment description | The method used |
| PT bal / Ins bal | What was still outstanding from the patient and from the insurer after the payment |
The two dates are the point of this report. A create date well before the payment date is a bill that took a long time to be settled, and this is where you find them.
Payment Categories — who paid, patient or insurer
The most detailed of the three. Same dates and store (it opens on your own store, with All locations available), plus filters for Insurance and Payment type, both starting at all.
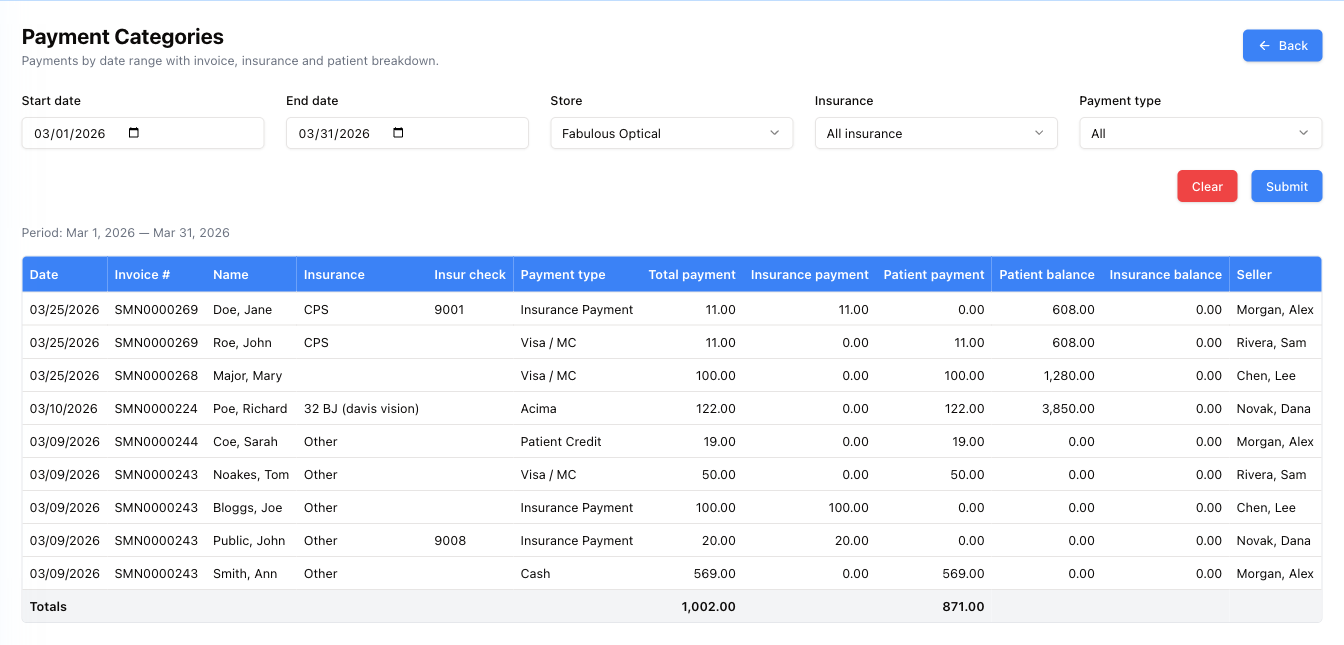
Each payment is split into what came from the insurer and what came from the patient, and what each still owed afterwards. The Seller column says who took it.
This is the report for the awkward question how much of last month was actually insurance money? — filter by an insurer and read the totals.
Insurance AR Report — how old the insurance debt is
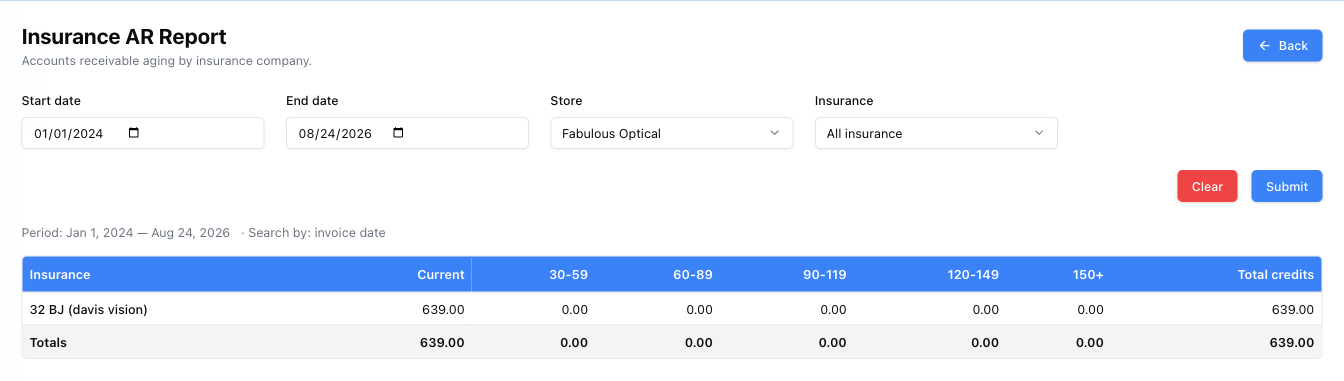
Four filters — Start date, End date (first of this month to today to start with), Store (your own, or All locations), Insurance (All insurance or one) — then Submit, and one row per insurance company, with the money owed spread across age buckets: Current, 30-59, 60-89, 90-119, 120-149, 150+ days.
Read it left to right. Debt in Current is normal business. Debt sitting in 120-149 or 150+ is a claim nobody has chased, and every column to the right is money slowly turning into a write-off. Total credits is what that insurer owes altogether.
Receipts Due By Month — what the practice owes vendors
The mirror image of the report above: not who owes you, but who you owe.
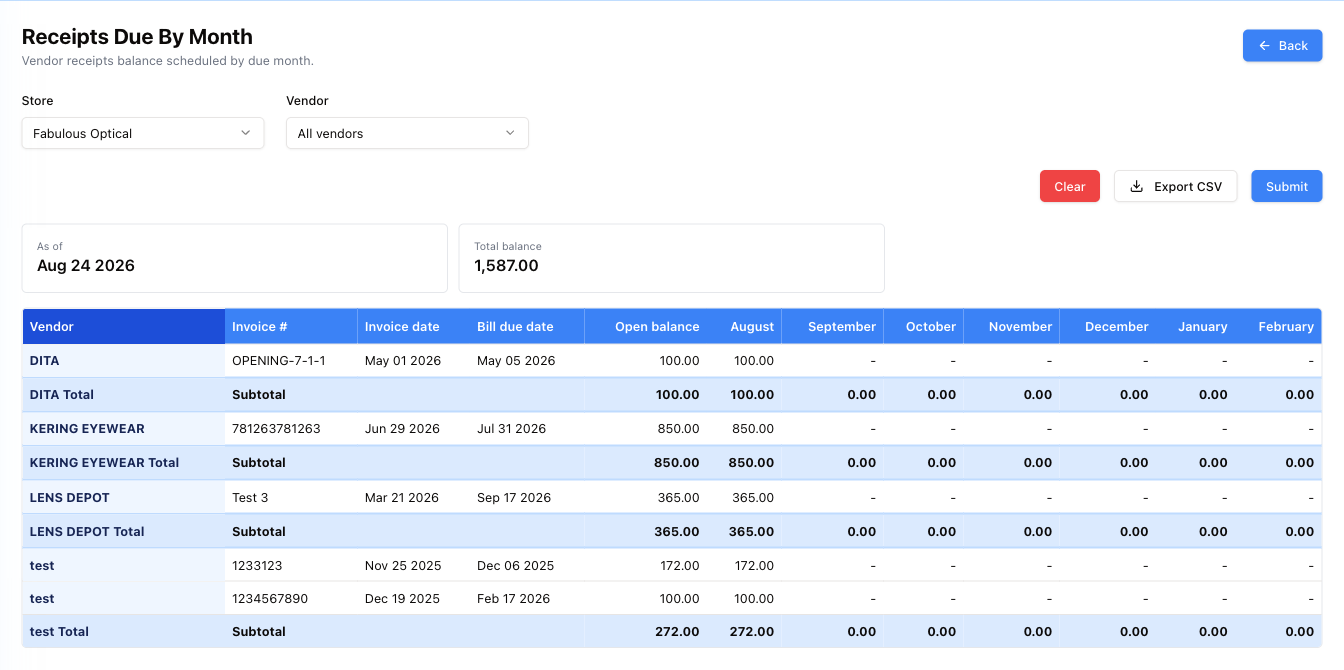
Two cards on top give the position at a glance — As of today's date, and the Total balance outstanding across all vendors.
The table lists each unpaid vendor invoice — Vendor, Invoice #, Invoice date, Bill due date, Open balance — and then spreads that balance into the month it falls due: August, September, October and so on. Each vendor gets a Subtotal row.
There are no date filters here; the two filters are Store (it opens on your own store — pick All locations for the whole practice) and Vendor (starting at All vendors). Export CSV takes the result into a spreadsheet once the report has run.
The due month comes from the Payment Terms set on the vendor receipt. Get the terms wrong there and the bill lands in the wrong column here, so a figure that looks odd is usually a terms problem, not a maths problem.
Filter by Vendor to prepare a single supplier's payment run, or by Store to see one location's obligations.
Patient debt — AR Reports and Credits
These two sit in the Reports group at the top of the menu rather than under Accounting, but they belong here: they are the patient side of the same money.
AR Reports
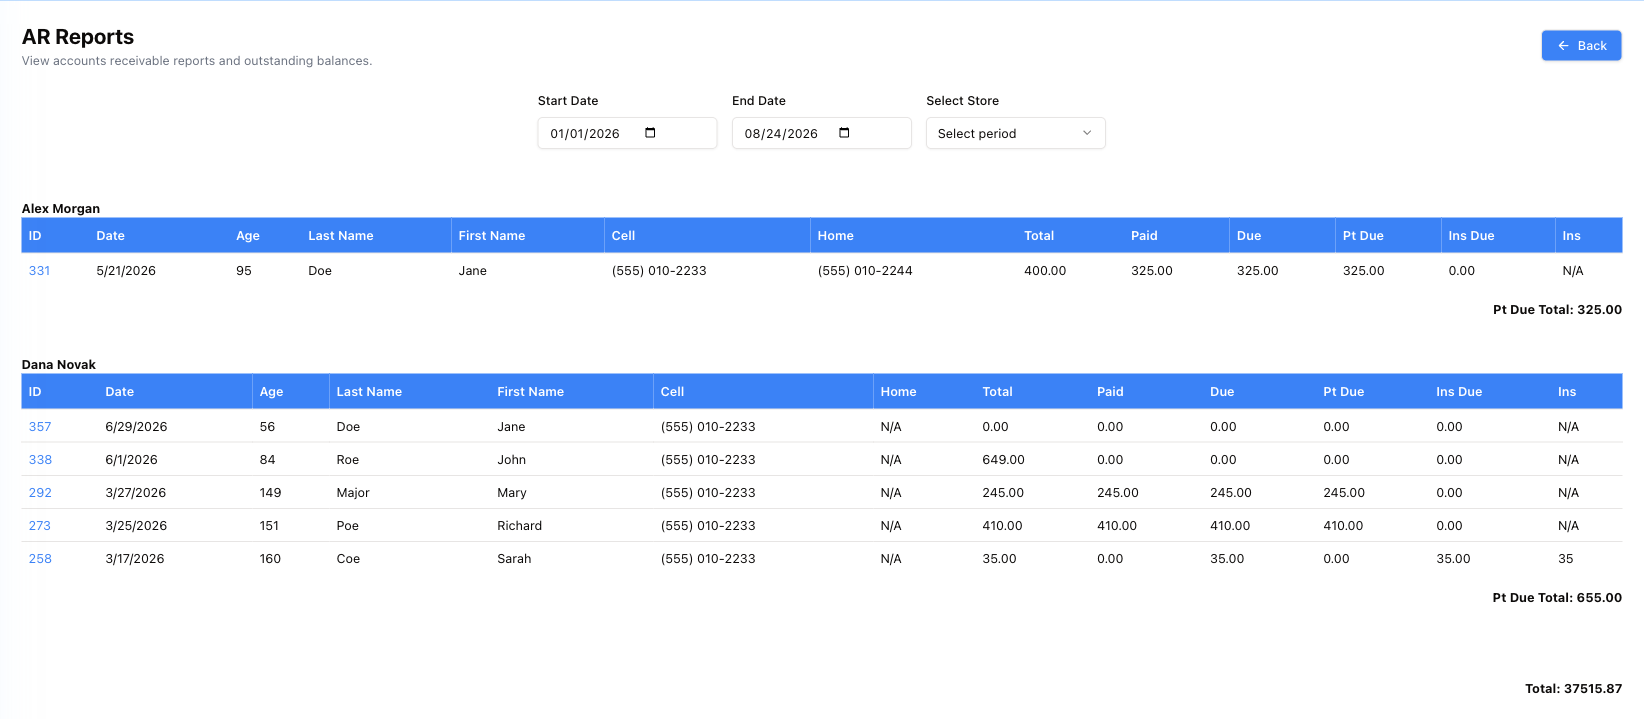
Outstanding invoices for a period, grouped by the member of staff who raised them. Each group has its own table and its own Pt Due Total, and the page ends with a grand Total.
Filters are Start Date, End Date and Select Store. There is no Submit button: the list loads as soon as the page opens (dates empty, no store picked) and reloads every time you change a filter.
The columns give the invoice ID (a link straight to it), the Date, the Age of the debt in days, the patient's name and phone numbers (the cell — or the work number when there is no cell — and the home number), then the money — Total, Paid, Due, split into Pt Due (the patient owes it) and Ins Due (an insurer owes it) — and finally Ins, the insurer concerned.
The Age column is what makes it a working list rather than a report. Sort your attention by it: a 167-day-old patient balance is a different phone call from a 5-day-old one.
Grouping by seller is deliberate — the person who raised the invoice is usually the person who should chase it.
Credits Report
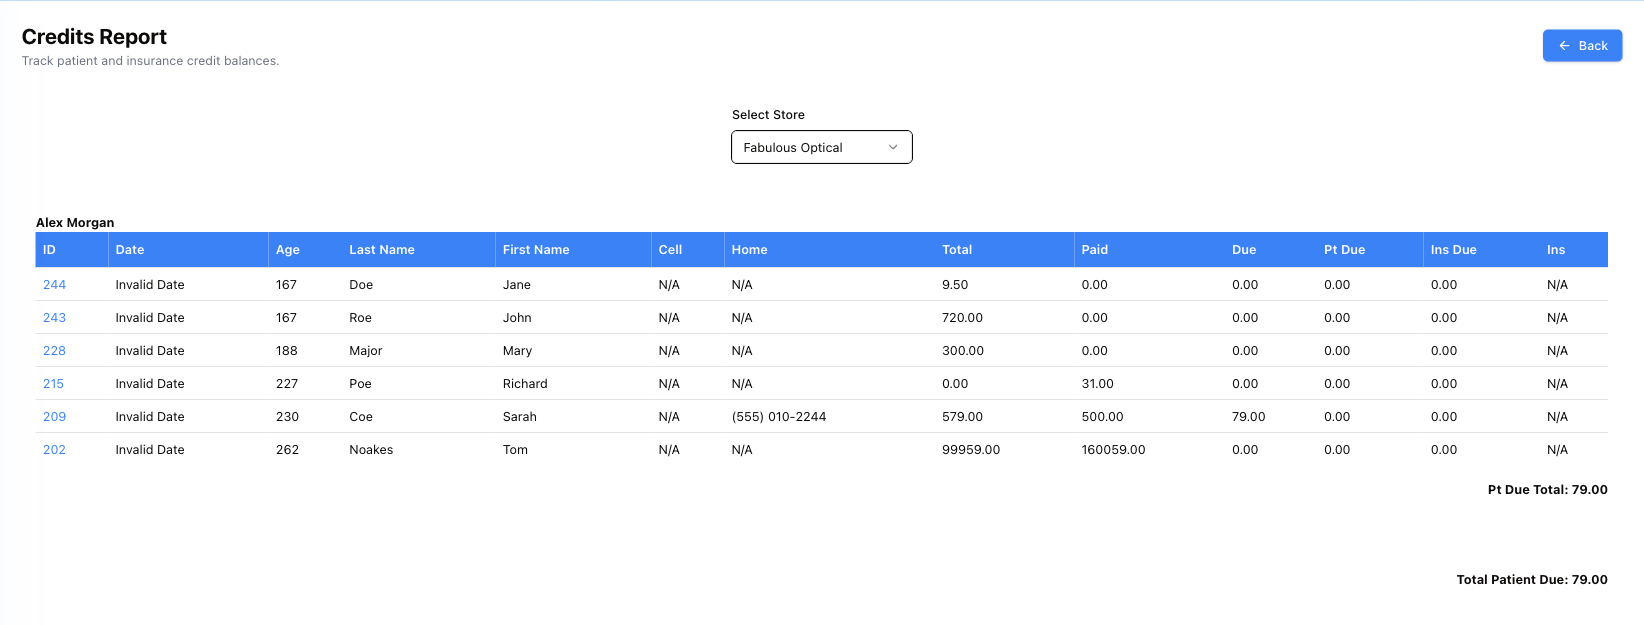
The same shape without a date range: a snapshot for one store, grouped by staff member, ending in Total Patient Due. There is no Submit button — it opens on your own store and loads straight away; pick another store in Select Store and it reloads.
Use it before a stocktake of the books, or when a patient claims they have credit sitting with the practice.
Two things to know before you rely on it. The Date column currently displays Invalid Date on every row — a known display fault; the money beside it is fine. And the per-employee line labelled Pt Due Total is summing the invoices' Due, not their Pt Due, so it will not always agree with the same-named line in AR Reports.
Related
- Accounting — the working screen these reports summarise
- Daily Reports — closing the day
- All reports