Sales reports — what sold, who sold it, where the patients came from
The largest group in Reports. They all look at the same sales, from different angles — so the trick is knowing which angle answers your question.
| You want to know | Open |
|---|---|
| What a store sold, invoice by invoice or line by line | Sale |
| Which categories the money came from | Category Sales |
| Optical versus sun, Rx versus plano | Sale by Type |
| Whether a brand is doing better than last year | Brand |
| Whether a member of staff is | Representative |
| What each seller earned | Commission |
| What is billed to insurers | Insurance |
| Which exam codes were used | Prof Code |
| How patients heard about the practice | Referral and Invoices |
Two habits before you start.
Every report shows nothing until you press Submit — an empty screen is not an empty result.
And check the dates. Most of these open with the date fields empty, so pressing Submit straight away can give you everything or nothing. Two exceptions: Sale opens on the first of this month to today, and Sale by Type on yesterday to today. The blue buttons fill the dates in for you — YTD, MTD, Prev Month, Today on most reports, This Year / Last Year on Brand and Representative, and Prior Pay Period / Current Pay Period on Commission. Every one of these buttons also runs the report straight away — you do not need Submit after it.
Sale — what one store sold
The most powerful of the group, and the one you can click through: every row opens its invoice.
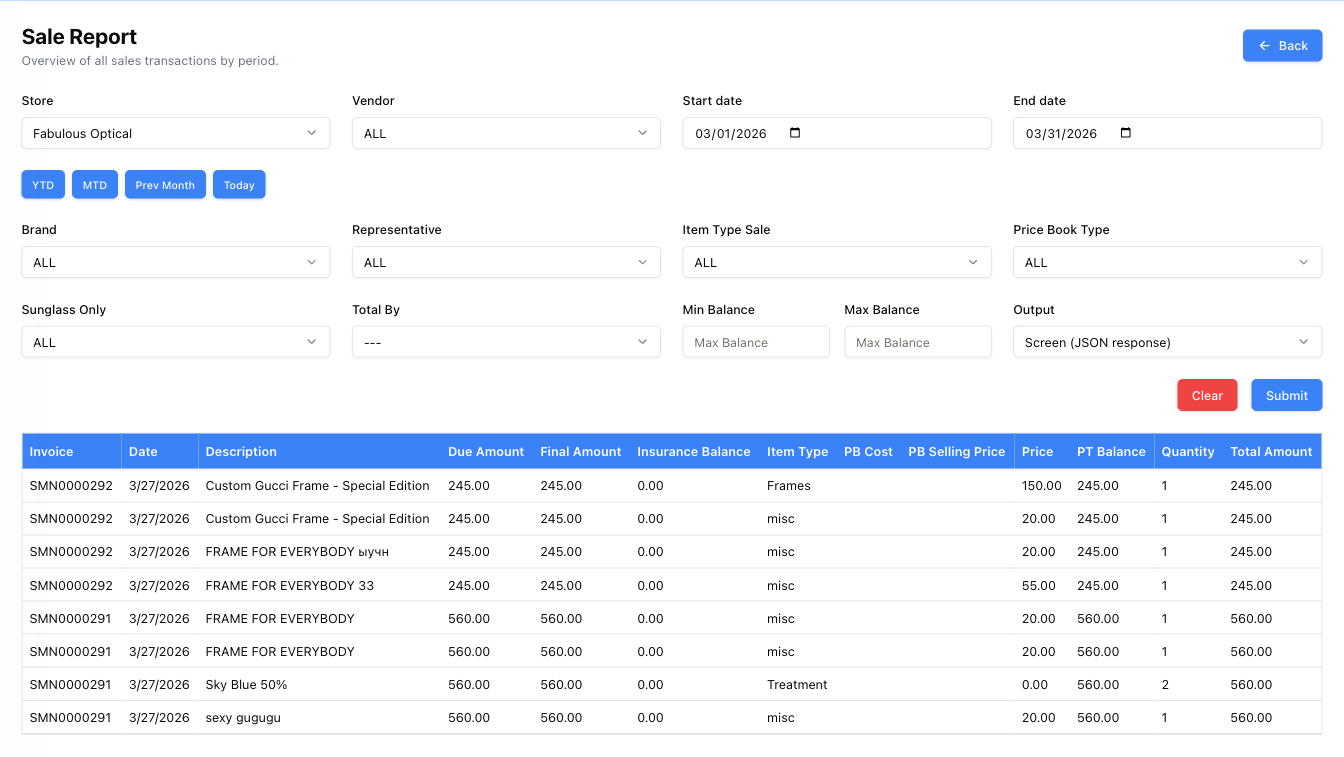
Run it
- Pick the Store. The list shows only the stores you are allowed to report on, and starts on your own store (or the first one you are allowed, if your own is not in the list). There is no "all stores" choice — this report is always for one store.
- Check Start date and End date — they open on the first of this month to today. Or press YTD, MTD, Prev Month or Today, which sets the dates and runs the report at once.
- Choose what one row means with Show: By invoice (the default) or By item.
- Narrow it down with the filters below if you need to, then press Submit.
The two views
By invoice — one row per invoice. The Items column says how many item lines on that invoice matched your filters (with the item type in brackets). Amount adds up only those matching lines, while Invoice total, Final, Due, Patient bal. and Insurance bal. are for the whole invoice. A bold Total row at the bottom adds up Amount, Final, Due and both balances.
By item — one row per item line, with its Description and item type, Qty and Price. The invoice figures (Invoice total, Final, Due, the balances) repeat on every line of the same invoice, so do not add them up in this view — the note under the table says the same. Switch to By invoice for those totals.
Both views also show the Sale key (what kind of item it is) and the price book figures PB cost and PB selling — what the price book says the item costs and should sell for. A Price well below PB selling is where a discount was given away from the list price. A negative Amount or Price is shown in red.
The cards on top
- Invoices (By invoice) or Item lines (By item, with "in N invoices" beside it).
- Sold (matching lines) or Sold (price × qty) — the money from the lines that matched.
- By invoice: Invoices final and Still due (patient / insurance) — the total still owed, then the patient part and the insurance part.
- By item: Quantity.
The filters
- Employee — who sold it. All employees by default.
- Item type — Frames, Lenses, Contact lenses, Professional services, Treatments, Additional services, Insurance lines, or All items.
- Vendor and Brand — pick a vendor first; Brand stays greyed out ("Pick a vendor first") until you do, and resets when you change the vendor. Vendor and brand normally mean the frame's vendor and brand. Set Item type to Lenses or Contact lenses and they apply to the lenses or contact lenses instead — the hint under Brand tells you which.
- Open balance — Any invoice, Patient still owes or Insurance still owes. This is how you build a list of debts worth chasing.
- Item description contains — free text, for example a brand name or "progressive".
- Line amount (price × qty) — From $ / To $: only lines worth between those two figures. Note this is the value of the line, not the balance still owed — for debts use Open balance.
- Sunglasses only — tick to see sun only.
Open an invoice from a row
Click any row and the invoice opens.
Two things can stop it:
- If you ran the report for a different store than the one you are working in, a yellow note above the table says so: "This report is for another store. An invoice opens only while your current store is that store — switch the store at the top left first." Switch your store, then click the row again.
- An invoice with no patient on it cannot be opened from here — you get a message saying so.
Export CSV
Export CSV downloads the report with the filters currently on the screen — sale_invoices.csv in By invoice view, sale_items.csv in By item view. It does not need Submit first, so check the filters before you press it.
Clear puts every filter back to its default but keeps the store you picked.
Category Sales — the money split by what it was for
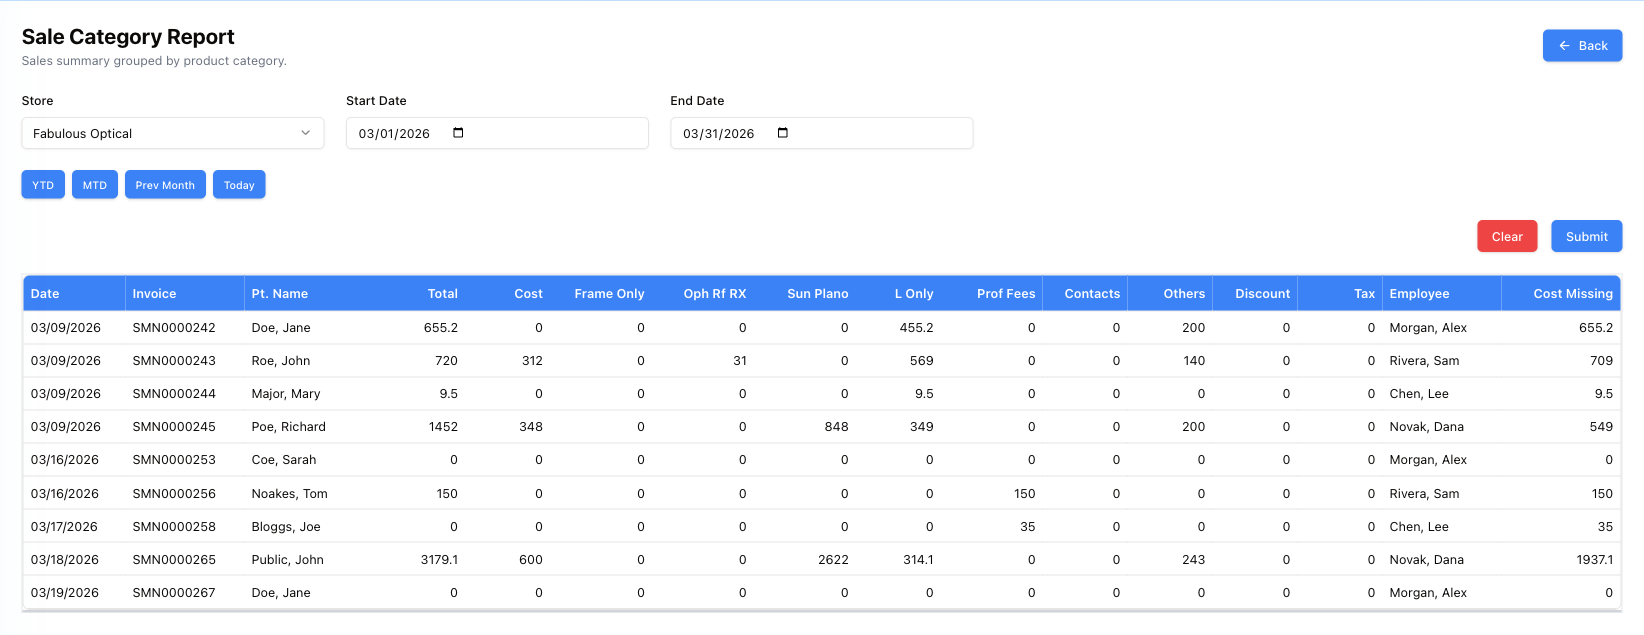
Filters: Store (your own to start with), Start Date and End Date (empty — fill them or use the quick buttons).
One row per invoice — Date, Invoice, Pt. Name, Total, Cost — with that total then broken into columns: Frame Only, Oph Rf RX, Sun Plano, L Only, Prof Fees, Contacts, Others, followed by Discount, Tax, the Employee who sold it, and Cost Missing. A TOTAL: line stays pinned at the bottom of the table.
The last column is the one to read first. Cost Missing is the value of items on that invoice with no cost recorded. Where it is large, the Cost column is understated and the margin the practice thinks it made is wrong. A row where Total is 655.20 and Cost Missing is 655.20 means nothing on it has a cost at all.
Treat Cost Missing as a to-do list for the price book, not as a number to report.
Sale by Type — optical against sun, Rx against plano
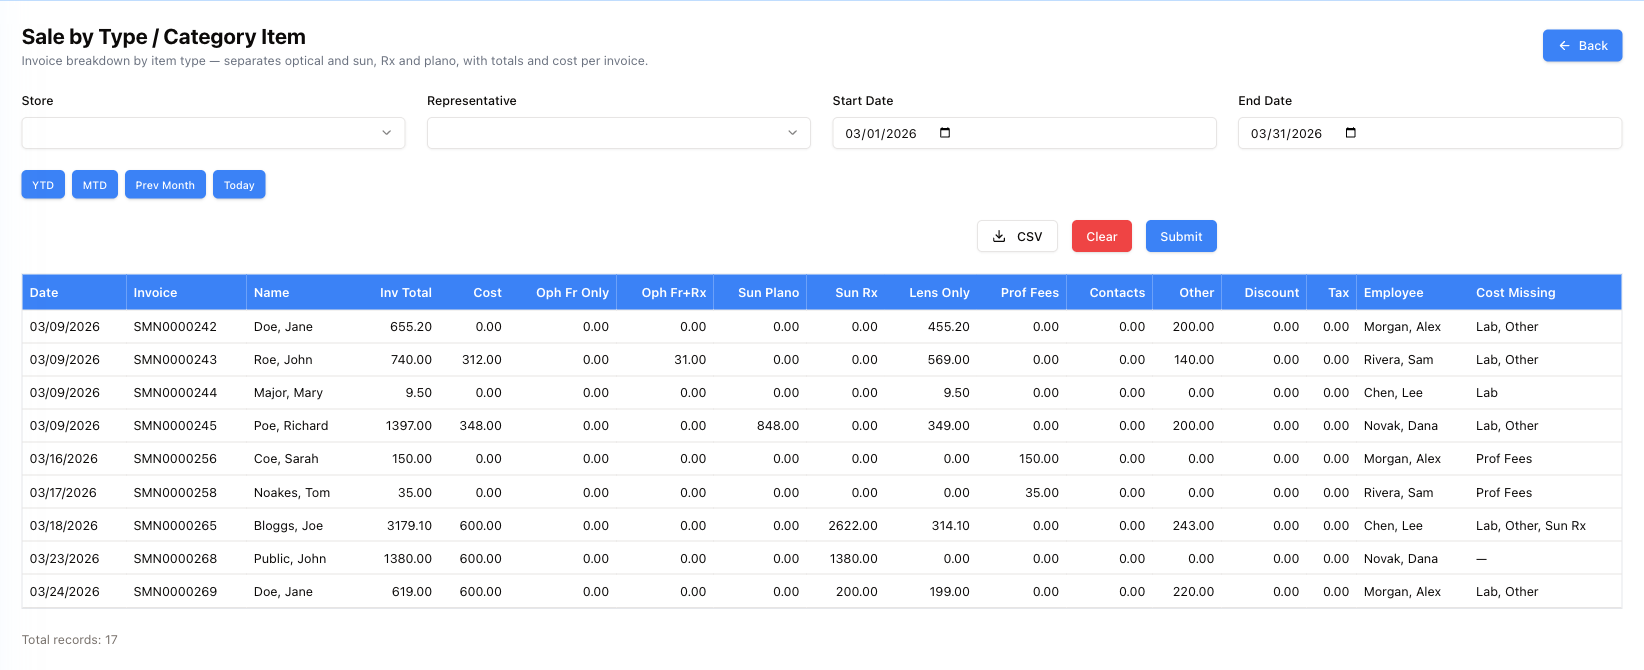
One row per invoice — Date, Invoice, Name, Inv Total, Cost — with the total cut differently from Category Sales: Oph Fr Only, Oph Fr+Rx, Sun Plano, Sun Rx, Lens Only, Prof Fees, Contacts, Other, then Discount, Tax, Employee and Cost Missing. A Totals row and a % Net of Tax row (each type's share) close the table, with Total records underneath.
Filters: Store (your own to start with), Representative, Start Date and End Date (yesterday to today to start with). The CSV button downloads the report with the filters on the screen — it does not need Submit first.
The distinction Category Sales cannot make is here: a sunglass sold plano and a sunglass sold to prescription are different businesses, and this report separates them. Filter by Representative to see whether one seller is carrying the Rx work.
Brand — this year against last
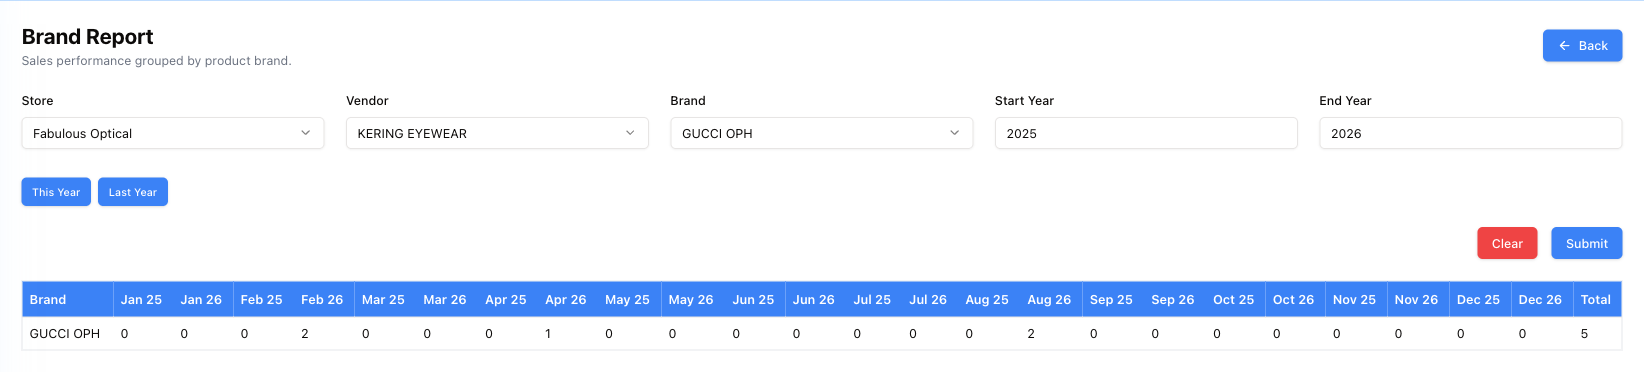
Pick the Store, optionally a Vendor and then a Brand (both show ALL when left empty), then type a Start Year and End Year. With two different years every month appears twice, side by side — Jan 25, Jan 26, Feb 25, Feb 26 — with the Total at the end.
The numbers are units sold, not money. Read across a pair and you see whether the brand is growing or fading in that month; read the Total and you see the year.
This Year and Last Year set both years to the same year and run the report — one column per month, no comparison. For this year against last, set Start Year to last year and End Year to this year, then press Submit.
Representative — the same, for people
Identical layout, with Employee in place of Brand: month-by-month units, this year against last, for each member of staff, filtered by store, vendor and brand. Here Start Year and End Year are picked from a list that starts at 2024.
Use it for the question is this seller better with this brand than that one? — the answer is a row.
Commission — what each seller earned
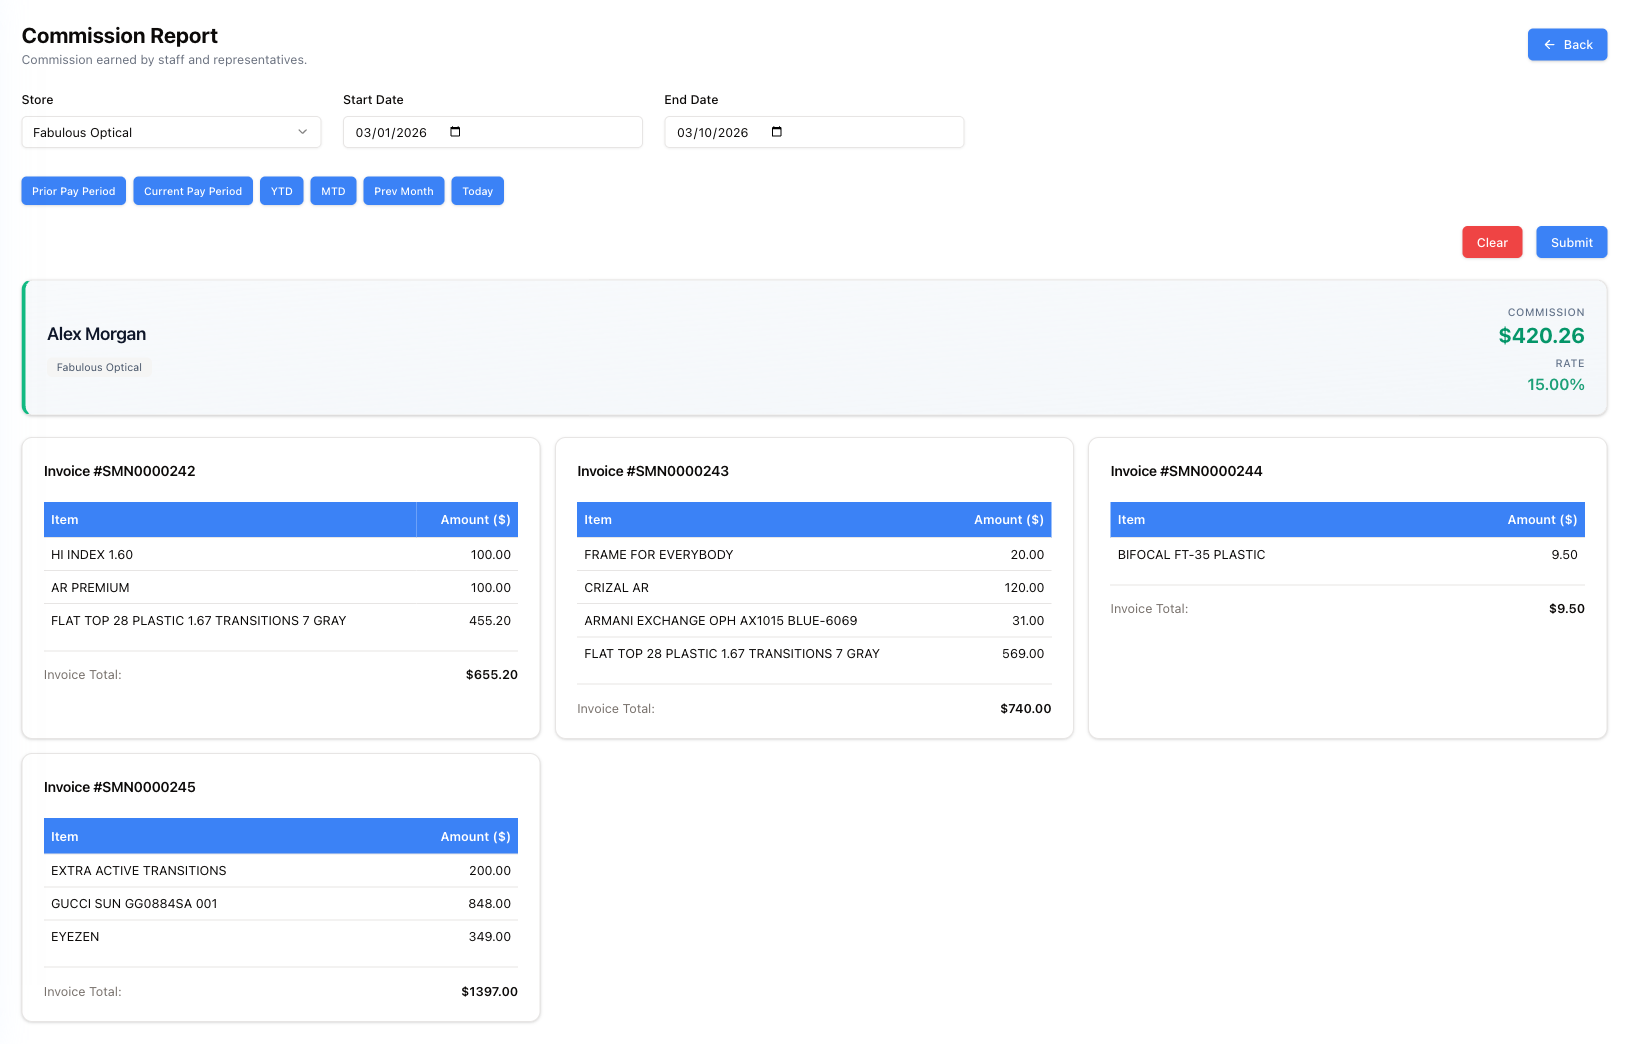
A block per employee. The header gives the commission for the period and the rate it was calculated at, then every invoice they sold appears as a card listing the items and the invoice total.
Because the workings are shown, a seller can check the figure themselves rather than taking it on trust.
The period buttons here are payroll-shaped: Prior Pay Period and Current Pay Period, alongside the usual YTD, MTD, Prev Month and Today. They do not read your real payroll calendar — Current Pay Period is simply the last 14 days up to today, and Prior Pay Period the 14 days before that (28 to 15 days ago). If your pay periods fall on fixed dates, type the dates in and press Submit.
Insurance — what is billed to insurers
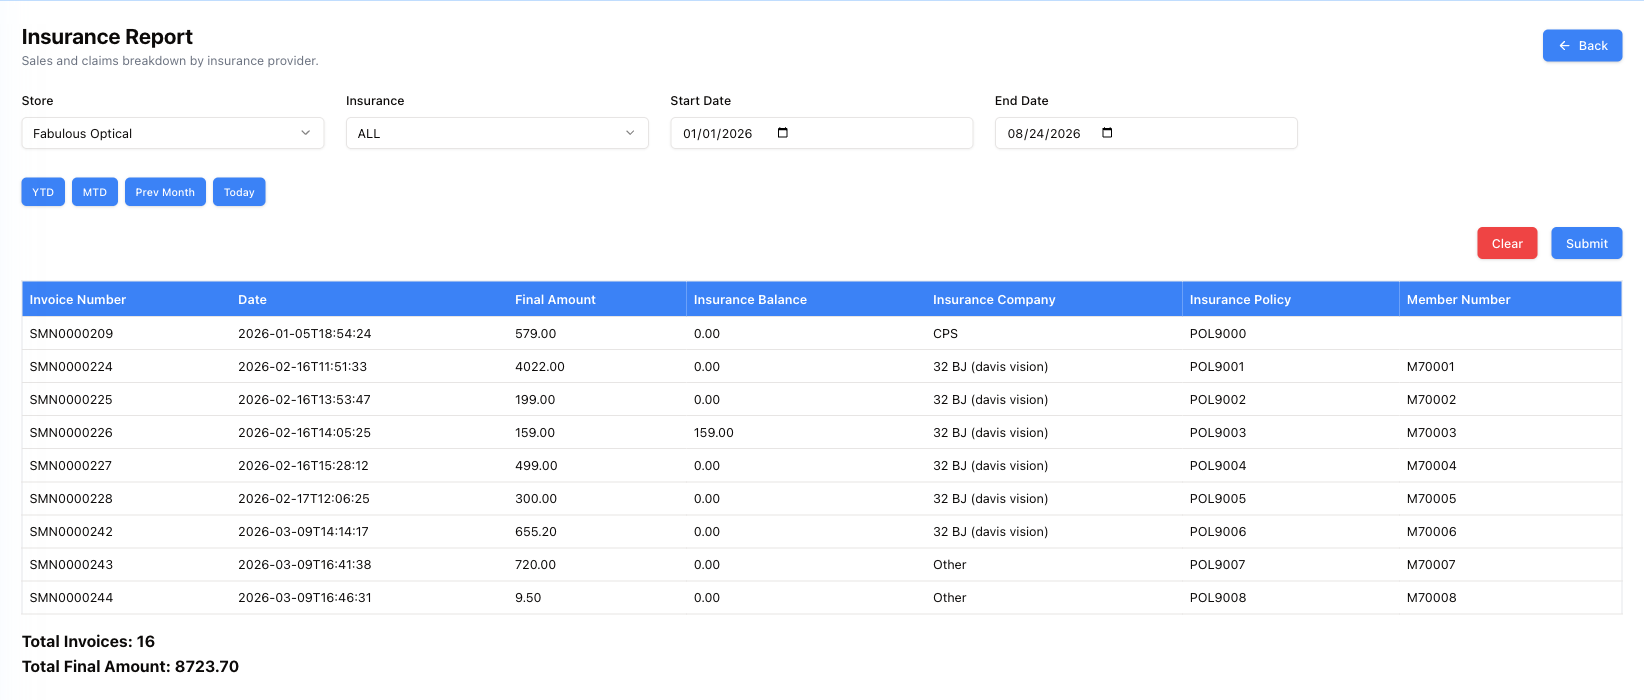
One row per invoice that has insurance on it: the Invoice Number and Date, the Final Amount, the Insurance Balance still outstanding, and which company, policy and member number it belongs to. Total Invoices and Total Final Amount sit under the table.
Filter by an insurer to see everything sitting with them. For the same money aged by how long it has been waiting, use the Insurance AR Report.
Prof Code — which exam codes were used
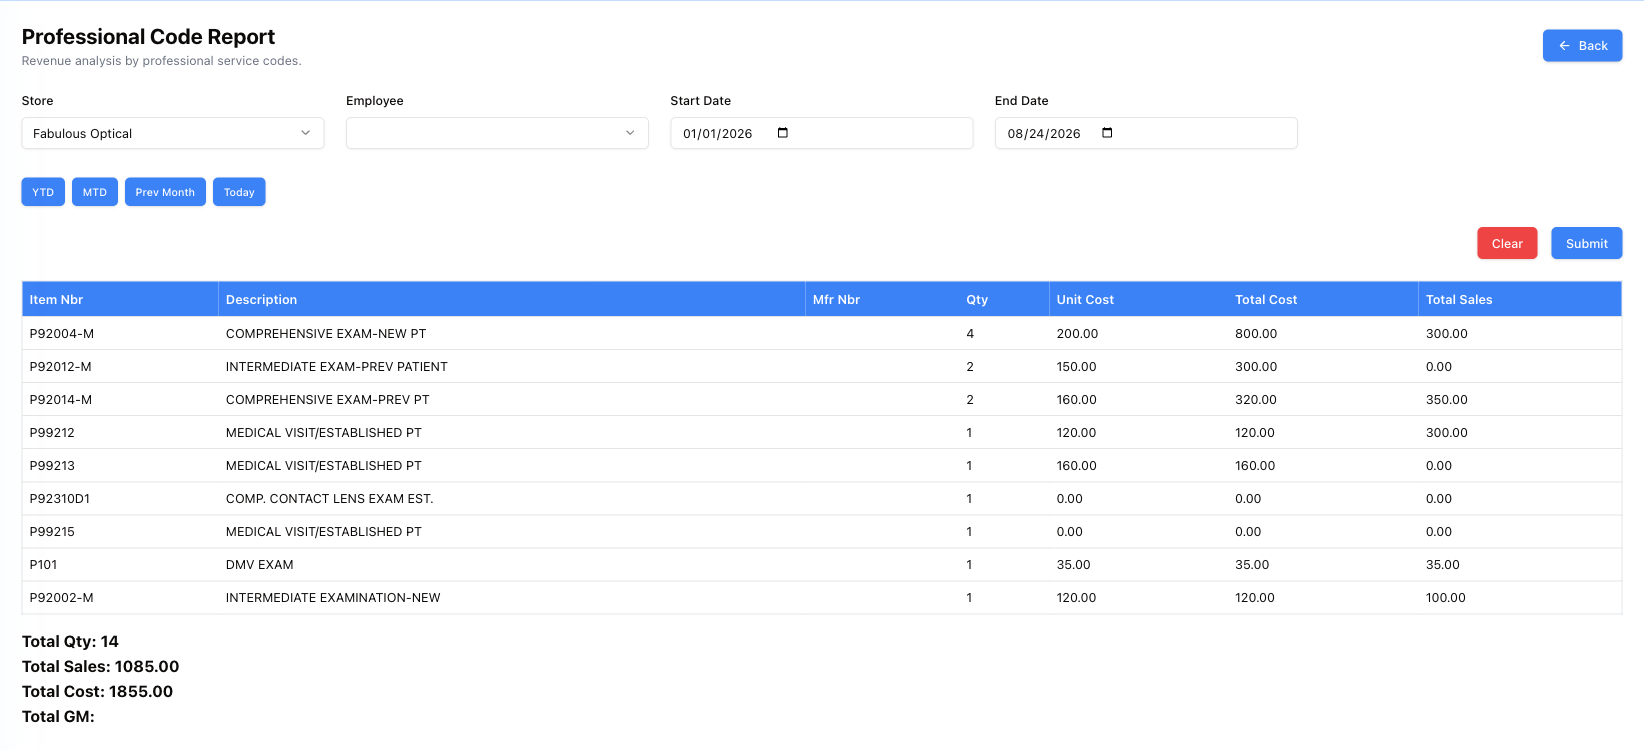
One row per professional service code — P92004-M Comprehensive Exam-New Pt, P92014-M Comprehensive Exam-Prev Pt, P99212 Medical Visit/Established Pt — with the Item Nbr and Description, the manufacturer number (Mfr Nbr), Qty, Unit Cost, Total Cost and Total Sales. Under the table: Total Qty, Total Sales, Total Cost and Total GM (gross margin).
Filter by Employee to see one doctor's coding. A code with a high Total Cost and a low Total Sales is work being done and not billed, which is usually worth a conversation rather than a spreadsheet.
For which codes each doctor put on their super bills, and with which diagnoses, use Doctor Productivity in Doctor and admin reports.
Referral — how patients found the practice
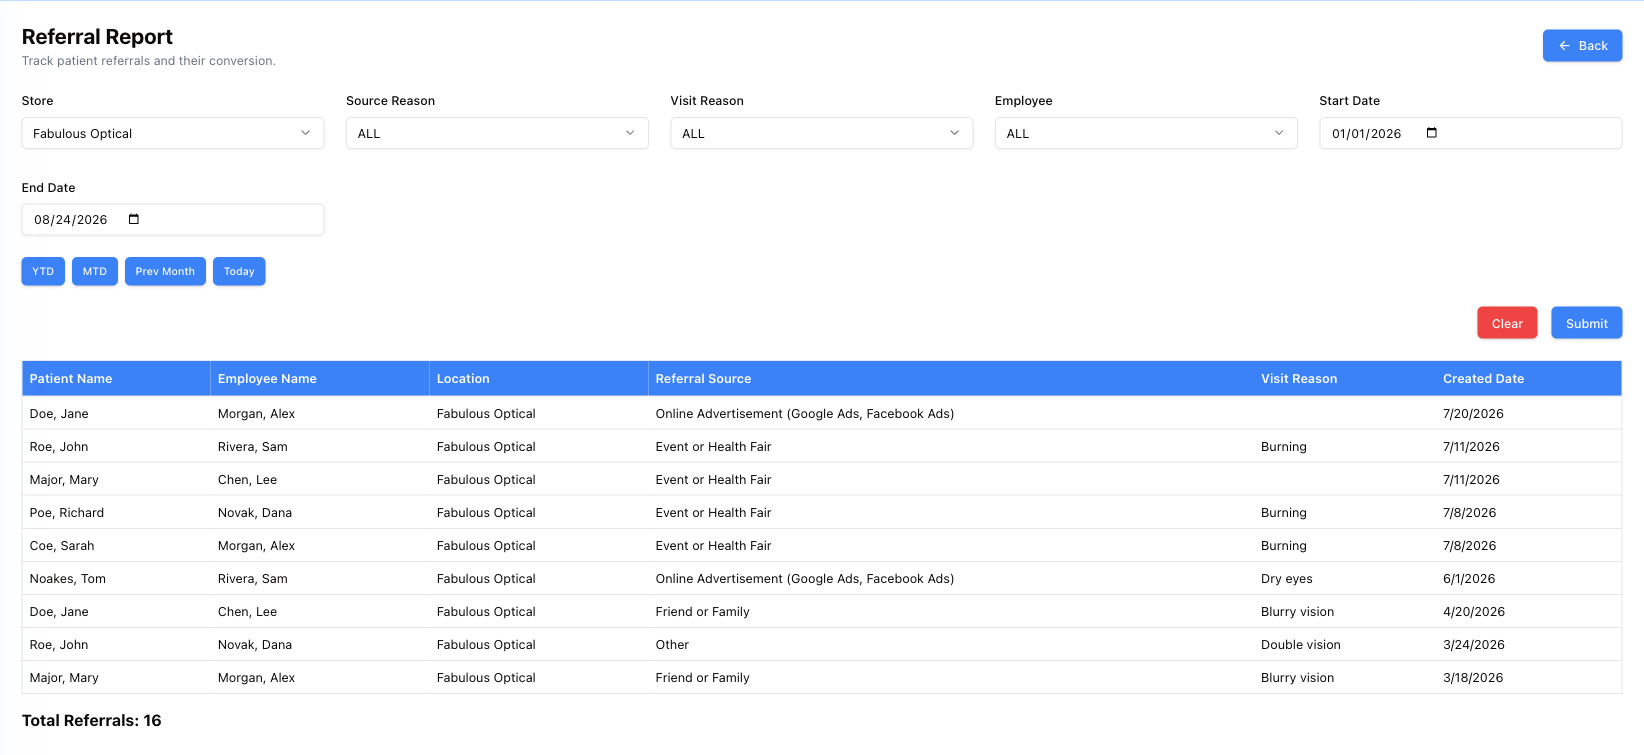
One row per patient, showing who registered them, the Location, the Referral Source they gave, the Visit Reason and the date. Total Referrals counts them at the bottom.
Four filters besides the dates — Store, Source Reason, Visit Reason and Employee — so you can answer did the health fair actually bring anyone? or which of us is asking the question at all?
Invoices — the same question as pictures
Despite the name (and the line under the title, which talks about invoices), the Invoices report is not a list of invoices. It is the referral picture drawn as charts, from the answers patients give on their first-visit questionnaire. You find it under Referals and Reasons on the reports list.
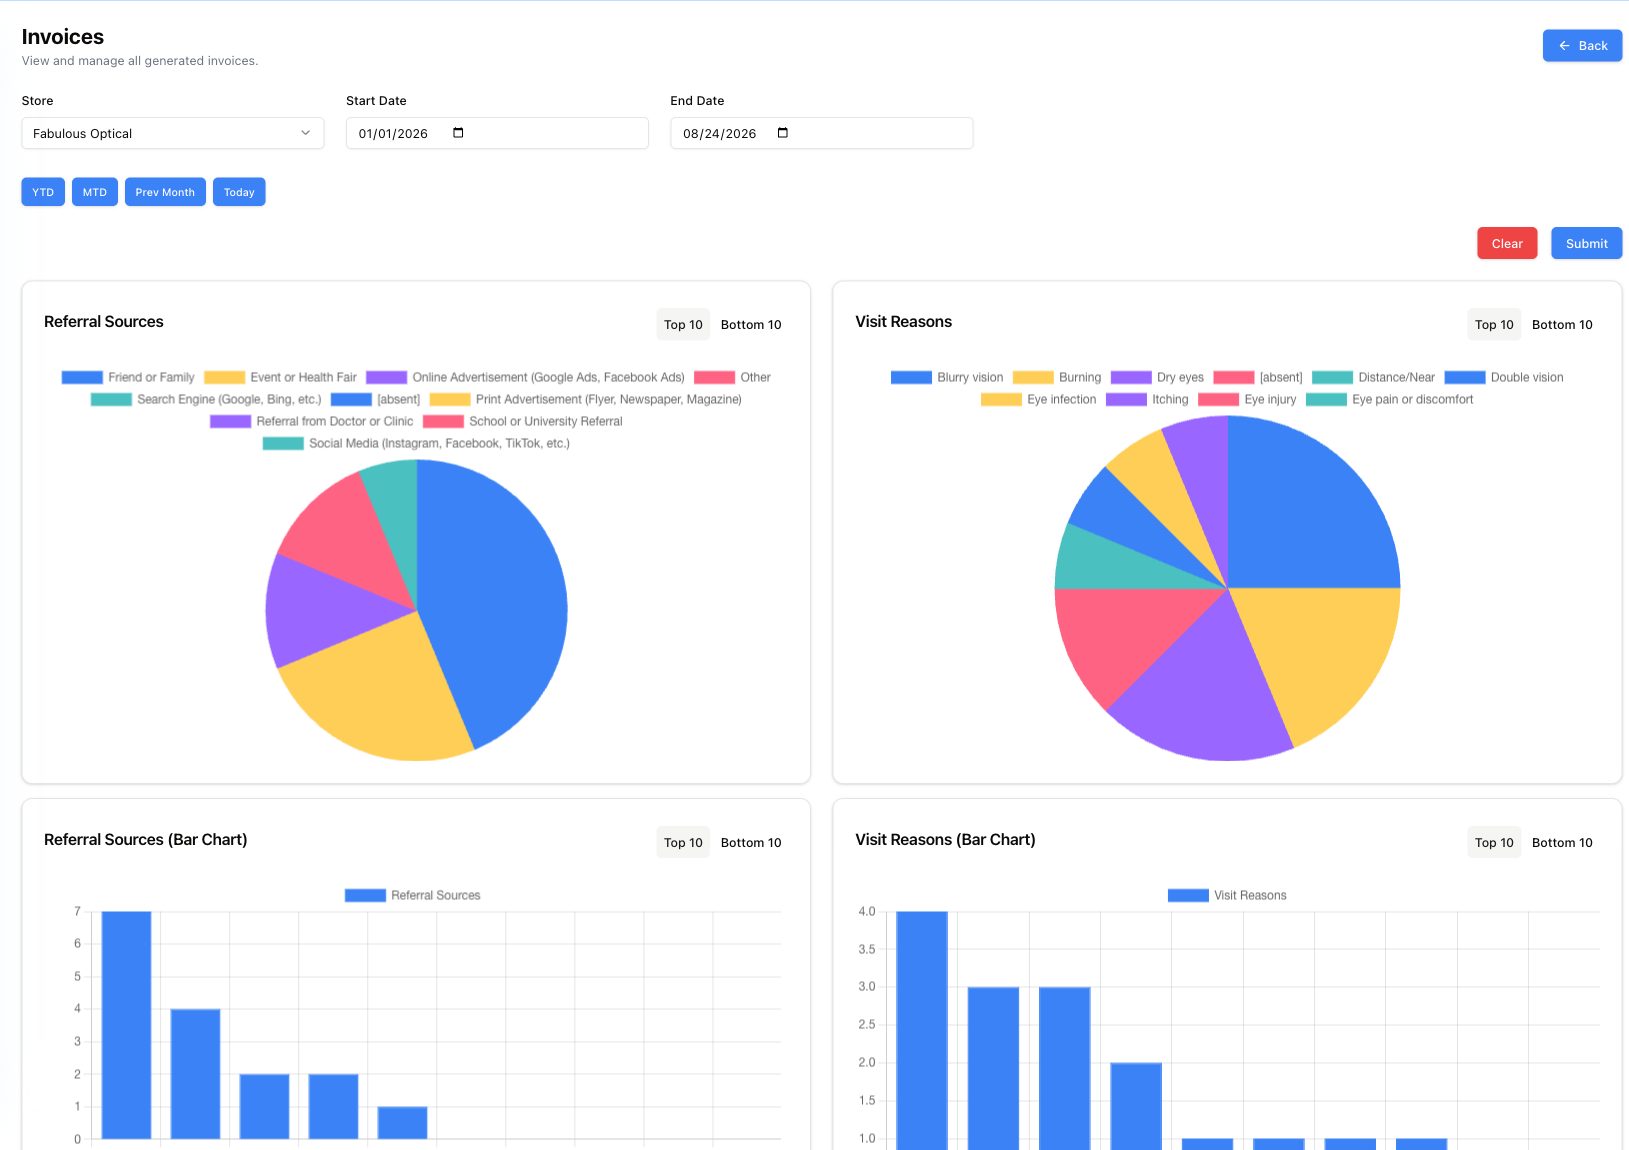
Up to four panels: Referral Sources and Visit Reasons, each as a pie and again as a bar chart, with Top 10 / Bottom 10 switches.
The Bottom 10 view is the useful half — it shows the channels bringing nobody, which is where the advertising money is going to waste.
Who sees what
This is the one sales report with its own permission. A manager gives it per store, in two parts, on the employee's Marketing Reports permissions card (Employees → Permissions):
- Referral Source — the Referral Sources charts.
- Visit Reasons — the Visit Reasons charts.
What that means on the page:
- The Store list shows only stores where you hold at least one of the two. It starts on your own store if it is in the list, otherwise on the first one.
- When you press Submit, only the charts you are allowed for that store are fetched. If you hold Referral Source at a store but not Visit Reasons, the Visit Reasons panel stays on No data available for that store.
- If you hold one of the two at no store at all, its panels are not shown on the page.
- If you hold neither anywhere, there is no form — just the message "You don't have access to the marketing reports. Ask a manager to grant them in your employee permissions (Marketing Reports: Referral Source, Visit Reasons)."
Run it
- Pick the Store.
- Set Start Date and End Date, or press YTD, MTD, Prev Month or Today — those run the report straight away.
- Press Submit.
Good to know
- Clear on the Invoices report also empties the Store. Pick the store again before pressing Submit, or you get "Please select a Store".
- Clear empties the Store on the other older reports too (Category Sales, Sale by Type, Brand, Representative, Commission, Insurance, Prof Code, Referral). The empty box then shows grey placeholder text — a store name, Fabulous Optical, on most of them and All Locations on Sale by Type — which is not a choice you have made. Pick the store again before Submit. Sale is the exception: its Clear keeps your store.
- On Sale, a vendor you pick filters frames unless Item type is set to Lenses or Contact lenses. If a lens vendor shows nothing, check the item type.
- On Sale, the Line amount filter is the value of the line, not money still owed. For debts, use Open balance.
- On Invoices, a message "You don't have access to this report for this store" means your permission does not cover the chosen store — ask a manager for the Marketing Reports permission there.